ROG Strix GA35 lab report
The ROG Strix GA35 gaming desktop was designed to deliver tournament-level gaming performance, and today, we’re diving deep into the data that proves it. Competing at the highest caliber in esports requires high frame rates and smooth graphics at every millisecond. The GA35 delivers with up to a Ryzen 9 3950X CPU packed with 16 cores and 32 threads and a powerful NVIDIA GeForce RTX 2080 Ti graphics card, offering blazing speed for multiplayer gaming, GPU-accelerated work, and more. Premium features like high-performance 3200MHz DDR4 RAM upgradeable to 64GB ensures that you can work with large datasets and multitask effectively without fear of slowdowns.
Our introduction to the GA35 details everything you need to know about the desktop from its esports-focused design down to every one of its I/O ports, and our hands-on article details what it's like to take advantage of all the performance on tap. You can also hit the official product page for a rundown of key features and links to other resources. This lab report focuses on sharing performance data from our own internal testing. The results are the same as the reference data we provide media in reviewer’s guides. Be sure to check your favorite tech sites and channels for independent reviews of the Strix GA35.
Test Notes
The collection of tests we use internally is based on benchmarks that are popular with top tech media. We used the following system configuration:
- Model number: Strix GA35
- CPU: AMD® Ryzen™ 9 3950X
- GPU: NVIDIA GeForce RTX™ 2080 Ti with driver version 26.21.14.4223
- Display: 14” 120Hz Full HD IPS-level panel with Adaptive Sync technology
- Memory: 32GB DDR4-3200 dual-channel
- Storage: 2TB SATA 7200RPM 3.5" HDD; 1TB M.2 NVMe™ PCIe® 3.0 Performance SSD
- OS: Microsoft Windows 10 Pro version 10.0.18363
- Power supply: 700W 80 PLUS Gold
To push the system to its limits, we run gaming benchmarks at the native resolution with the highest quality. Keep in mind that you can always hit higher frame rates by lowering the graphics settings and render scale, often with a relatively minor downgrade in visual quality.
Our desktops have multiple operating modes tuned for different scenarios. Turbo mode uses the highest fan speed and clocks to sustain maximum speed, while Performance mode adjusts the clocks and cooling to lower noise levels for gaming. Performance varies between these modes, so we run most of our tests in both to get a sense of the tradeoffs between them.
Performance can vary with driver, OS, and other software revisions. There can also be small differences due to natural variance between individual CPUs and GPUs. The following results may not exactly match the performance of every Strix GA35.
CPU performance
Cinebench R15
Cinebench tests 3D rendering performance using Cinema 4D. Its CPU benchmarks measure rendering speed with a single core and with all cores engaged, providing a helpful reference for content creators.
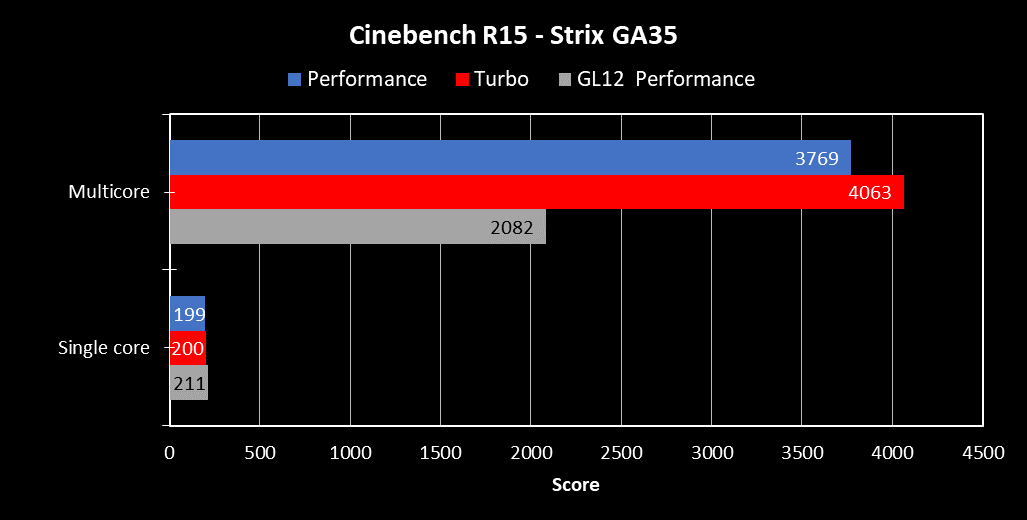
For context, we’re comparing the GA35 to its predecessor, the ROG Strix GL12CX, which has a Core i9-9900K CPU and GeForce RTX 2080 graphics. That machine’s Intel CPU maintains a slim lead in single-core rendering due to its higher peak clock speed, but the 16-core AMD processor in the GA35 dominates the multi-core test, nearly doubling the score of the GL12.
Cinebench R20
Cinebench R20 uses a version of the MAXON Cinema 4D renderer that’s optimized for newer CPUs. This test came out after the GL12CX passed through our testing labs, so we don’t have comparative data for it.
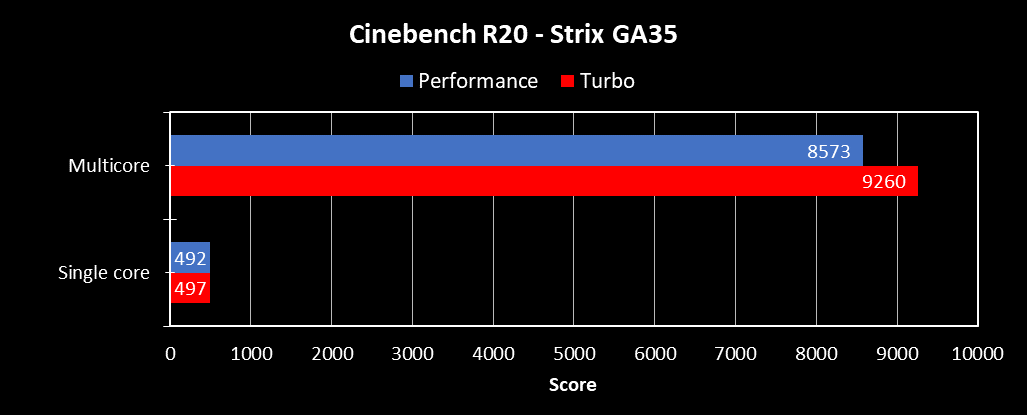
Turbo mode gives the GA35 a slight advantage in the single-core test. The difference is more noticeable in the multicore benchmark, where the fastest configuration has an 8% advantage over Performance mode.
AIDA64
AIDA64’s CPU benchmarks focus on the processor. CPU Queen targets branch prediction, while Photoworxx measures performance with 2D photo processing algorithms.
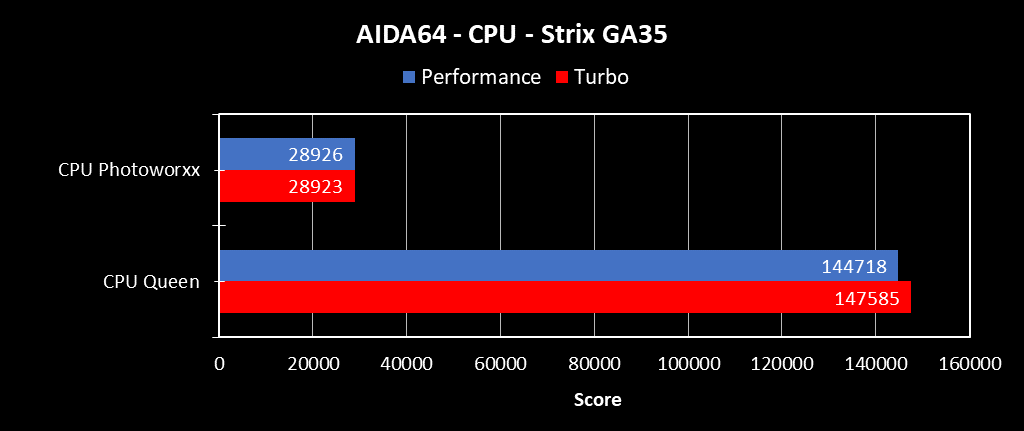
The difference between operating modes is minimal in the Photoworxx test, but Turbo mode has a slight edge in CPU Queen.
Graphics Performance
Heaven
Unigine’s Heaven benchmark focuses on stressing the GPU to determine its performance and stability under an extreme DirectX 11 workload.
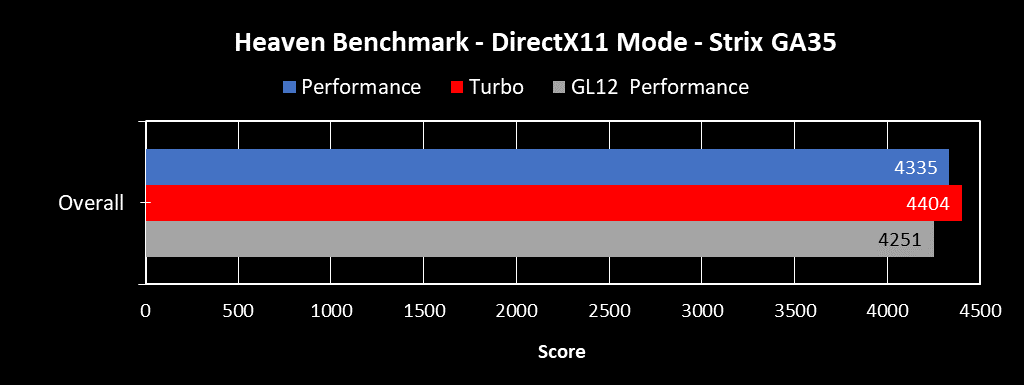
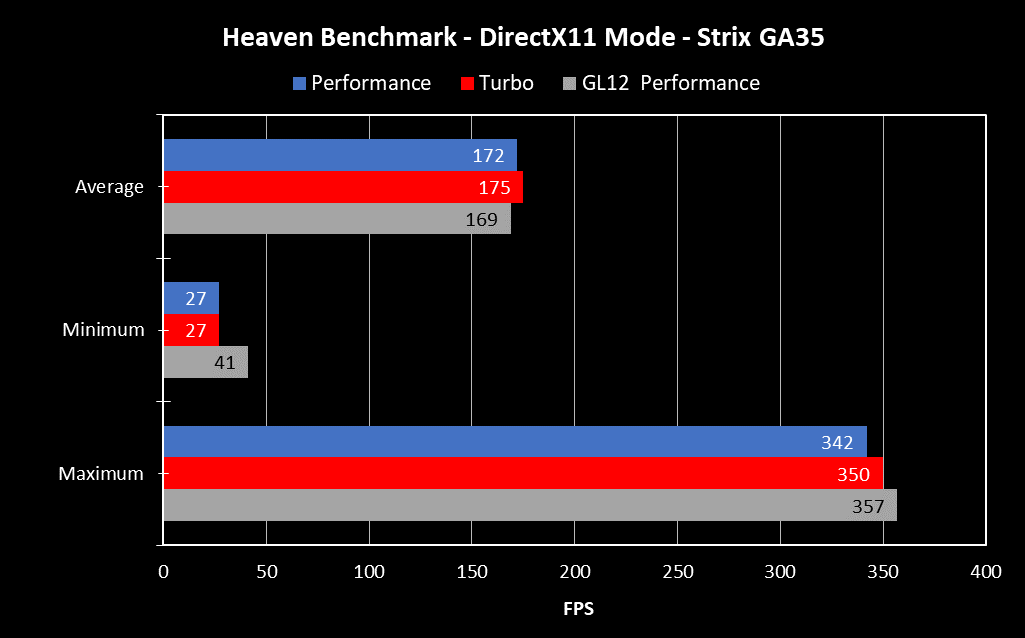
Performance and Turbo mode for the GA35 are closely matched in this test. Even the GL12 is competitive despite having a slight disadvantage in the graphics department. Its RTX 2080 isn’t as powerful as the RTX 2080 Ti in the newer system, but the older card still delivers superb performance.
3DMark
3DMark Fire Strike is another DirectX 11 benchmark that tests graphics rendering in high detail. It includes two graphics tests, one physics test, and a combined test that stresses both the CPU and GPU.
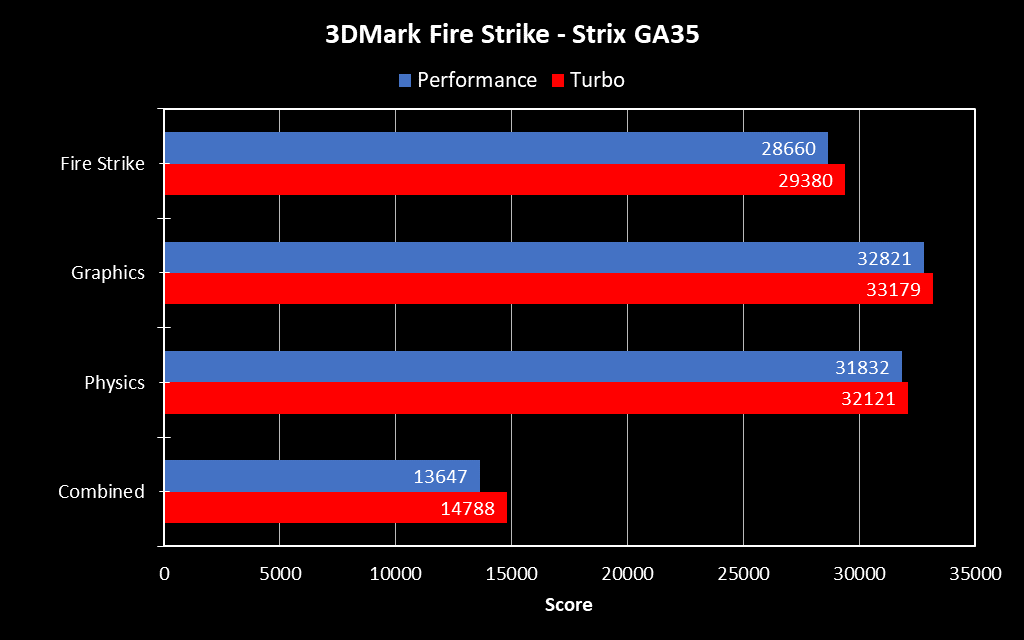
Performance and Turbo modes both boast high scores, with Turbo coming out slightly ahead across the board. For reference, the GL12CX scored 23206 in Fire Strike, more clearly illustrating the greater horsepower of the GA35’s GeForce RTX 2080 Ti.
3DMark Port Royal tests real-time ray tracing, which is increasingly being used to enhance lighting, shadows, and other effects in games.
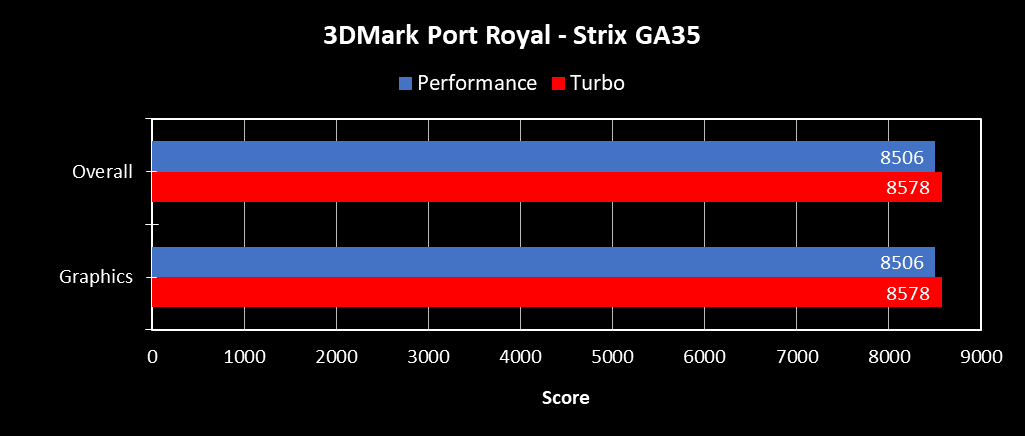
The average high-end gaming PC averages around 6490 in this test. Thanks to its RTX 2080 Ti GPU, which has significant hardware resources dedicated to accelerating ray tracing, the GA35 offers around 32% higher performance in Turbo mode.
Application performance
PCMark 10
Gaming machines frequently handle a wide range of everyday tasks, so we use PCMark 10 to gauge how well they perform across a broad array of applications. Individual application tests are grouped in Essential, Productivity, and Digital Content Creation categories that combine to form an overall score.
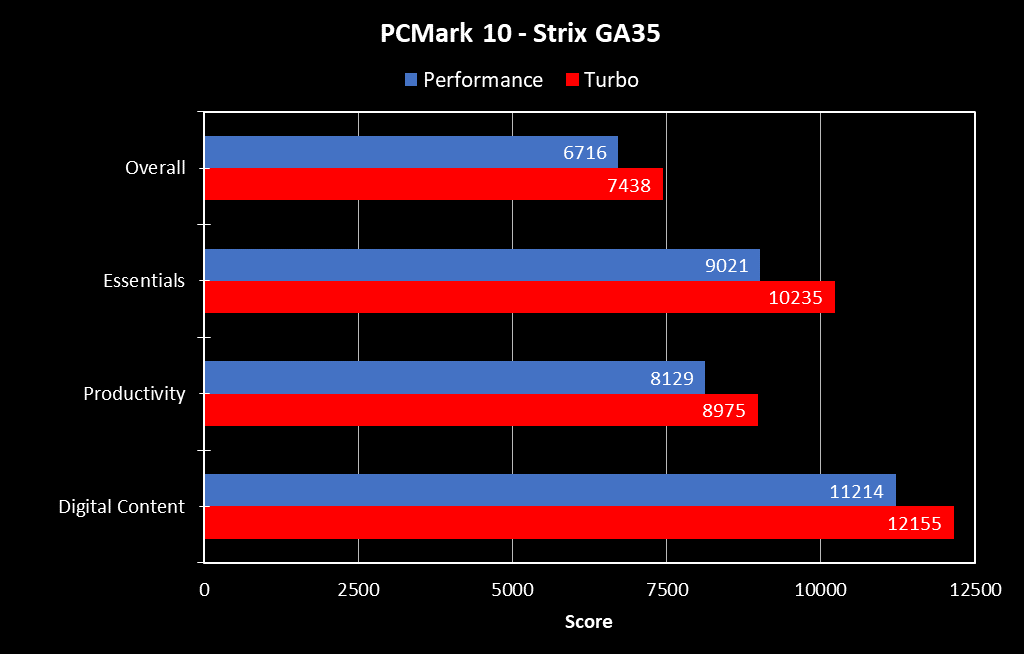
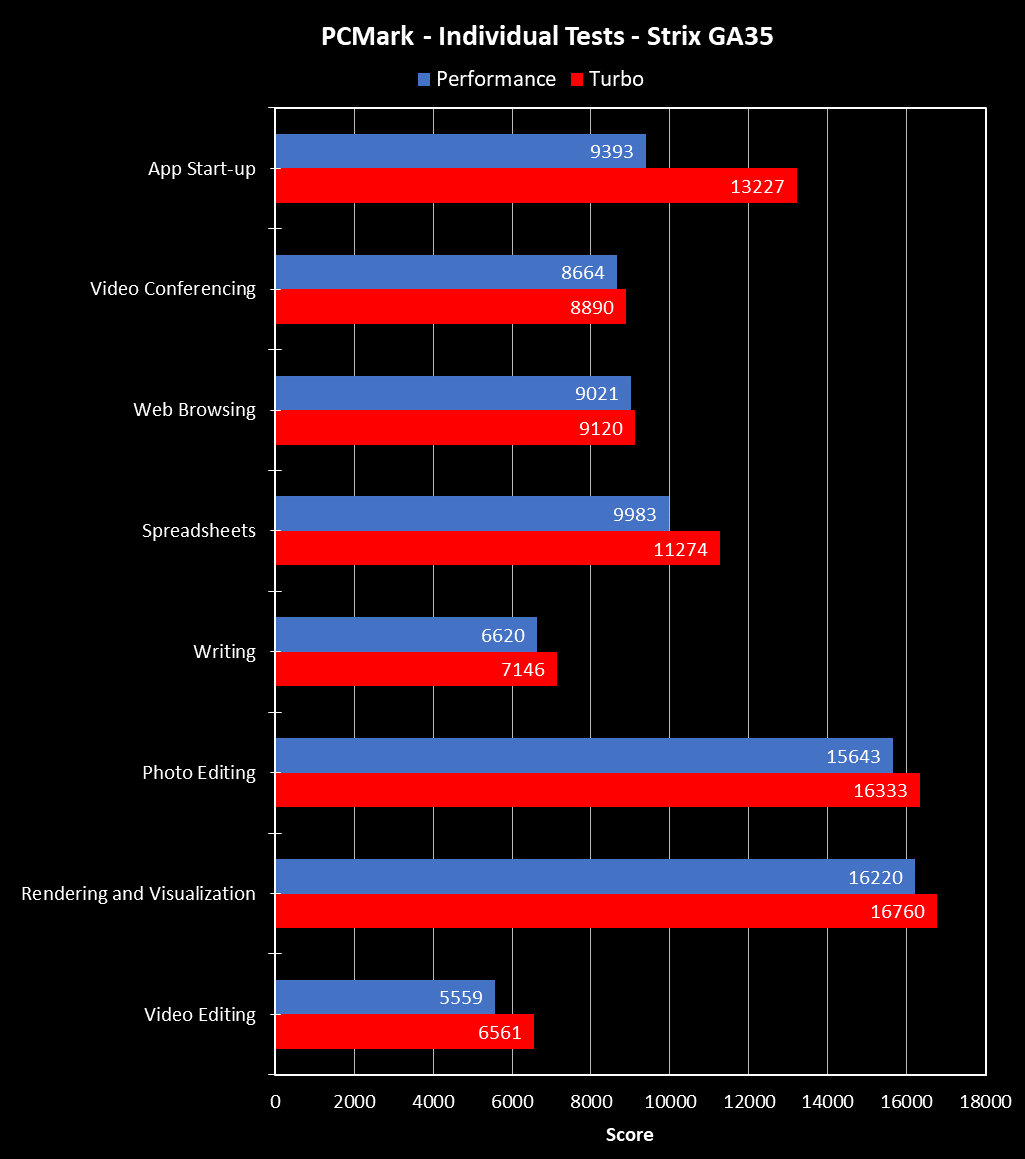
According to reported results, 4K-capable gaming PCs score around 5005. The GA35 hits 7438 in Turbo mode, which is nearly 50% higher. Turbo mode shows small performance gains in most of the individual tests, but it has a larger impact on video editing, spreadsheet work, and especially app start-up.
I/O performance
CrystalDiskMark
Storage performance depends largely on the SSD inside the system. We use CrystalDiskMark to quickly assess storage speed with both sequential and random I/O.
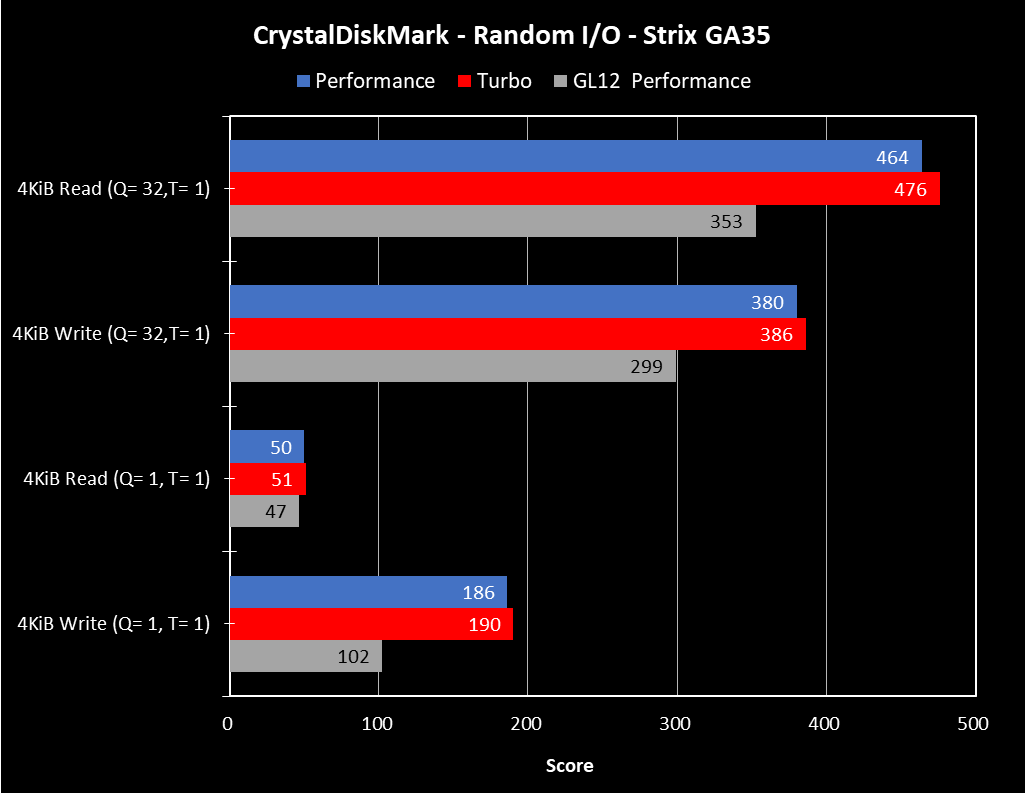
The Strix GA35 boasts consistently faster random read and write speeds than its predecessor, often by significant margins. There’s little difference in throughput between Performance and Turbo modes.
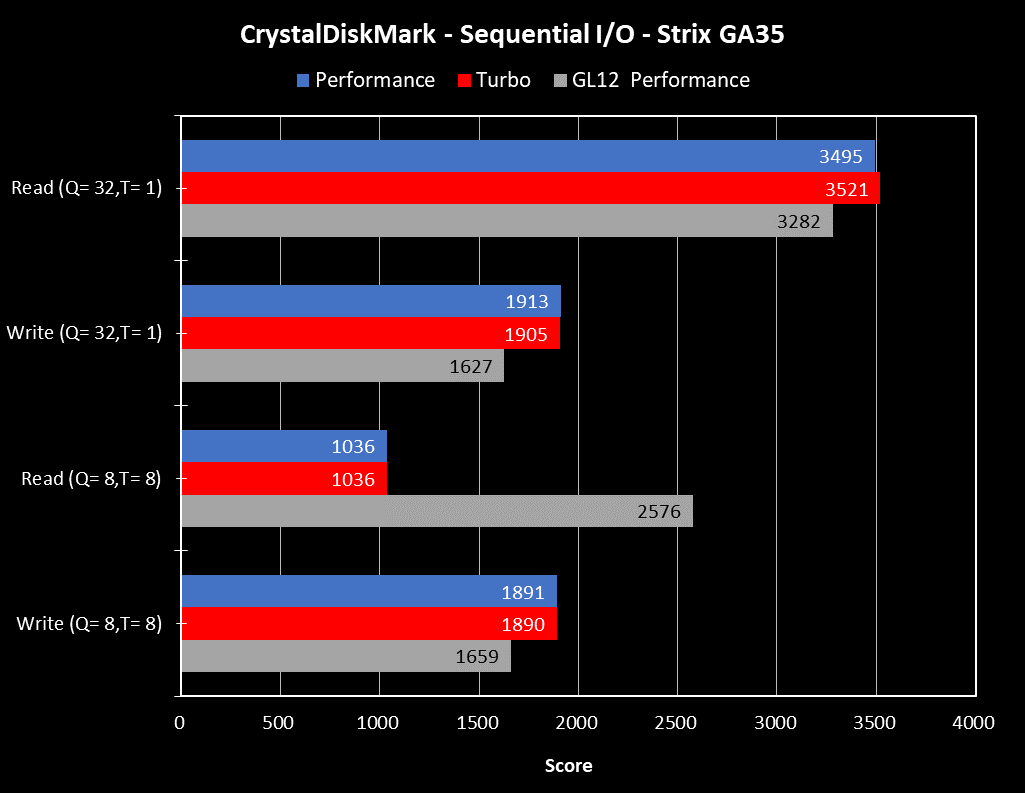
Sequential read and write speeds are much faster overall, which is typical of higher-end NVMe SSDs. Although the GA35 has a clear edge in most of the tests, the SSD in the GL12 scores particularly well with Q8T8 reads, where I/O is spread across eight parallel threads and queued eight requests deep.
AIDA64
AIDA64 also has a battery of memory bandwidth tests that measure the performance of system RAM.
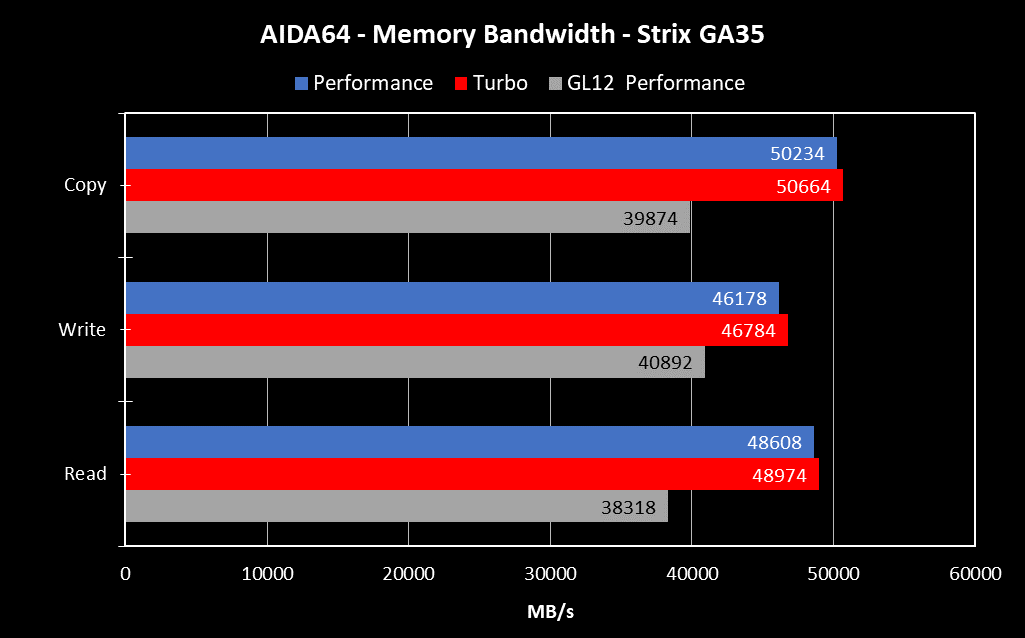
The previous generation GL12CX desktop uses DDR4-2666 RAM, while the GA35 uses DDR4-3200. That makes a big difference in memory bandwidth tests, where faster RAM pushes the newer Strix desktop well ahead of its predecessor.
Gaming performance
All our gaming tests run at maximum details and 1080p resolution. That’s the best way to stress the GPU, but it can also lower fps averages. You can hit higher frame rates by scaling back the graphics details, which is a particularly good tradeoff for fast-paced titles.
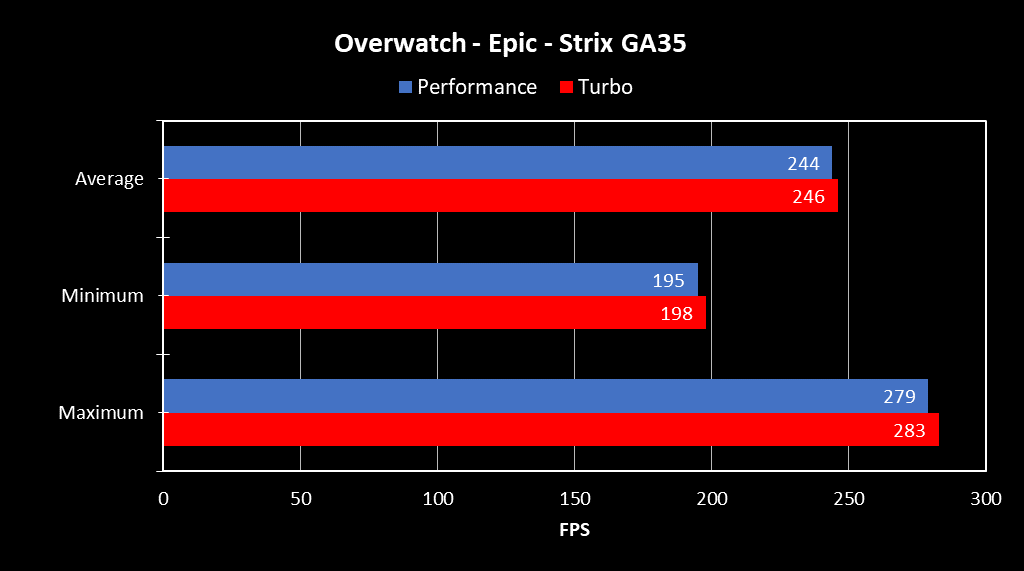
Overwatch performs very well on the GA35. Considering that most players prefer to sacrifice graphical fidelity in favor of higher frame rates, averaging around 244 fps with maximum detail settings is a testament to the power of the GA35.
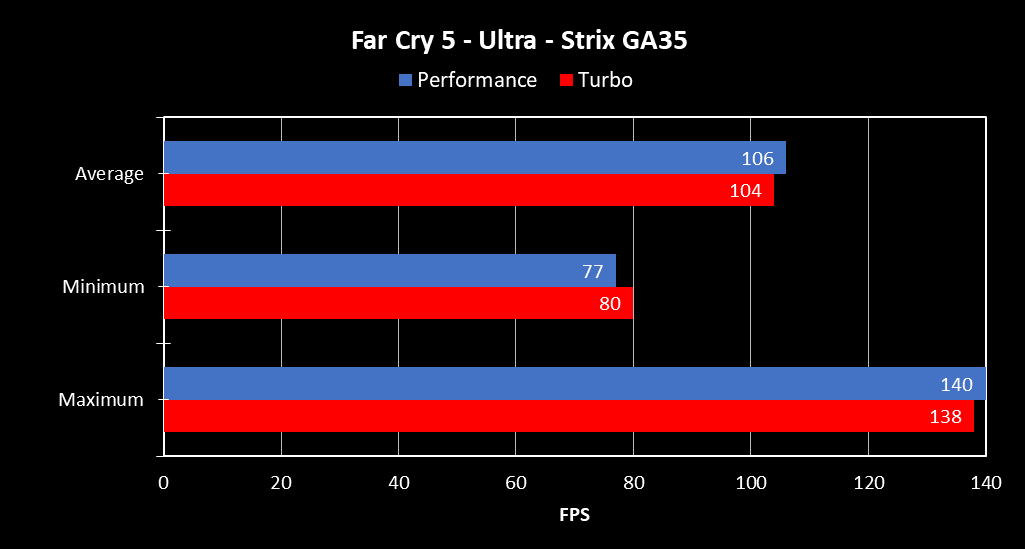
You can make the same tradeoffs to achieve higher performance with Far Cry 5, but that game still averages 106 fps with ultra settings, which is definitely smooth enough for its single-player and co-op gameplay. Breaking into triple-digit frame rates without sacrificing any of the game’s fancy graphical effects is impressive on its own.
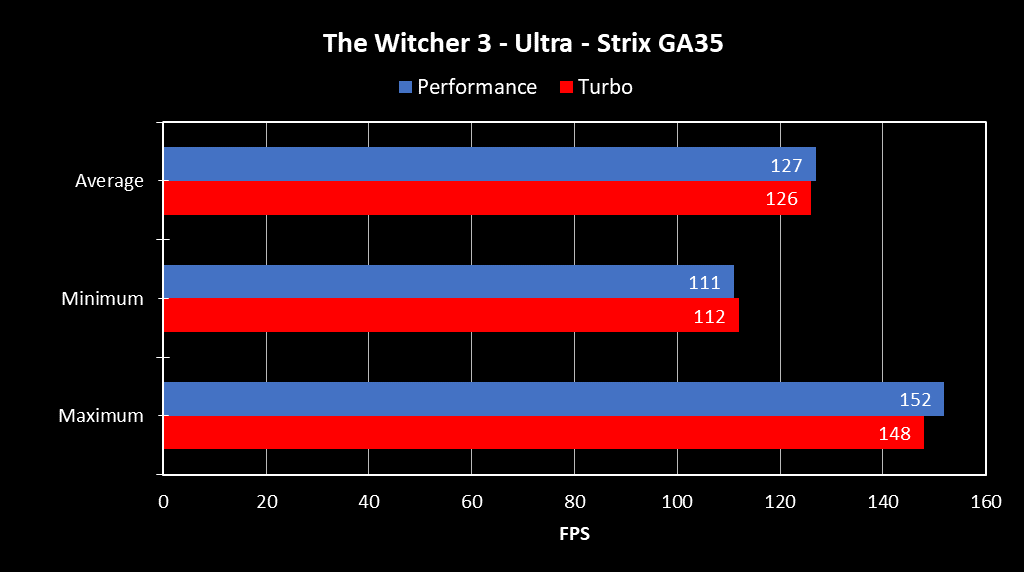
The Ryzen 9 3950X and RTX 2080 Ti let the GA35 slice through any game at the highest settings. This is clearly shown in The Witcher 3 with ultra settings, including NVIDIA HairWorks. Although the game was released back in 2015, it’s still one of the most demanding titles today, especially with the details maxed. Even with HairWorks hammering the GPU, the system still averages 127 fps.
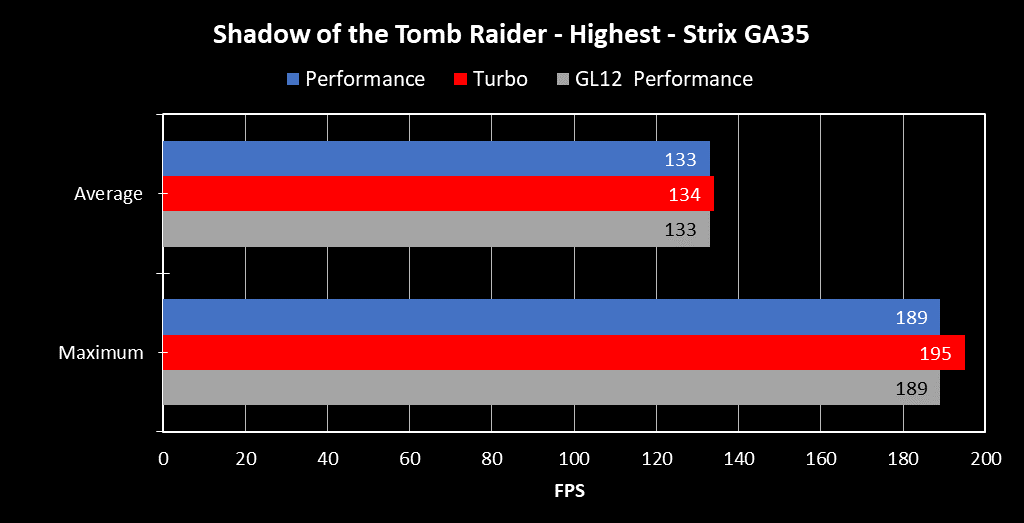
For Shadow of the Tomb Raider we have data for the GL12, as well. It hangs with the GA35 at the highest settings, with both machines averaging around 133 fps.
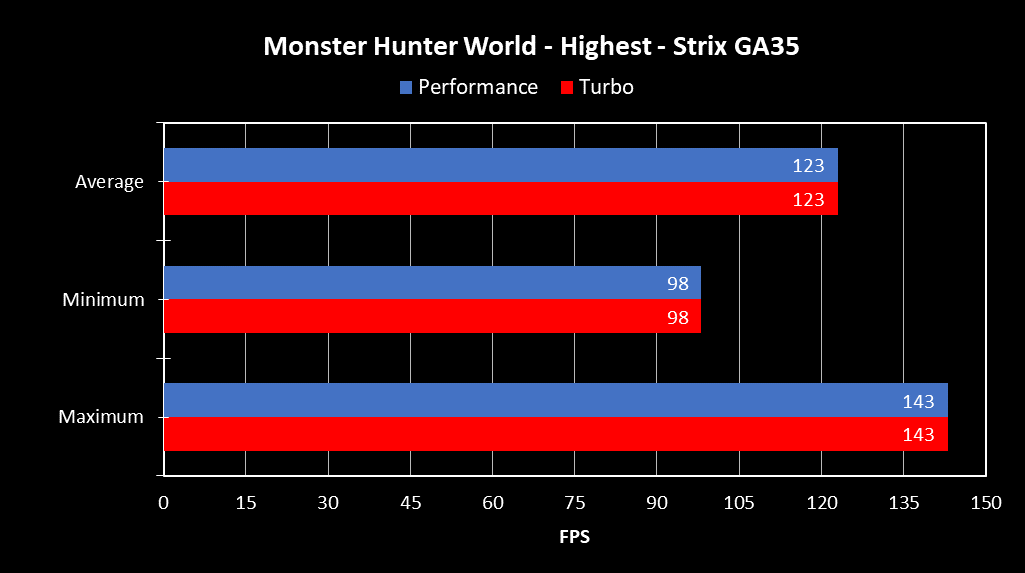
The GA35 averages 123 fps in Monster Hunter World, a more graphically intensive game. That’s outstanding for a AAA title at the highest settings, and it’s a sizable boost over the previous generation.
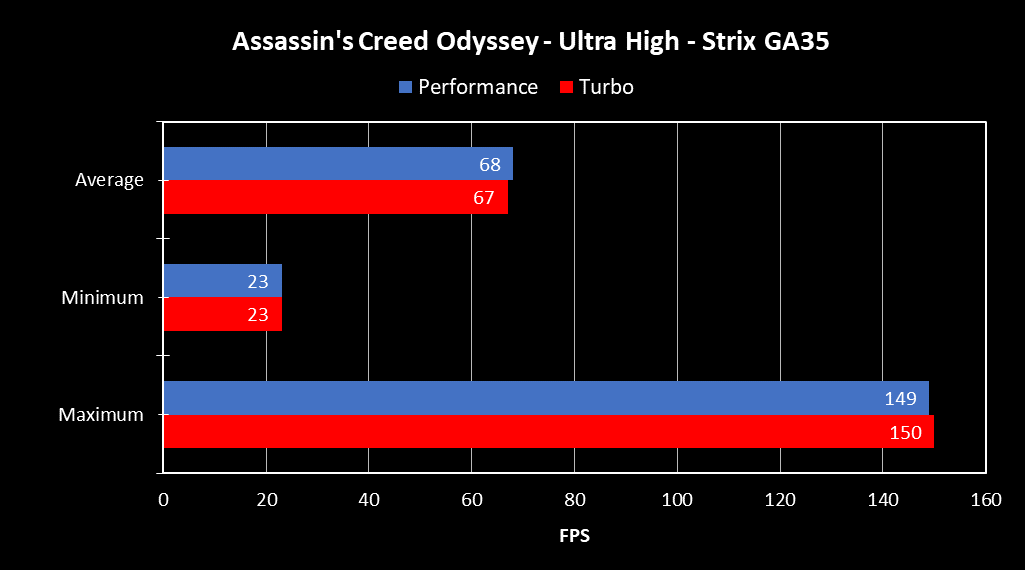
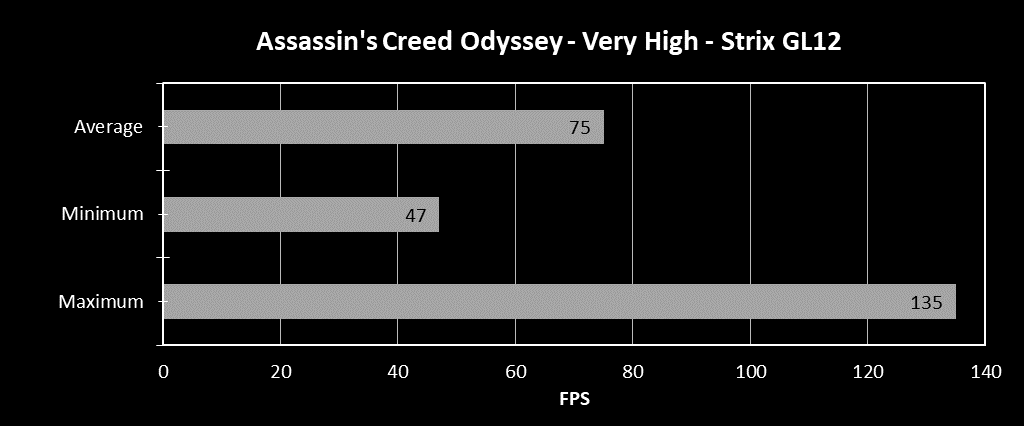
For Assassin’s Creed Odyssey, we have data from different settings: the GL12 with very high and the GA35 with ultra. Ultra graphics require more GPU and CPU resources, yet performance isn’t much slower, averaging 67-68 fps. The GL12 only manages 75 fps with lower details.
As we’ve seen throughout our gaming tests, Performance and Turbo modes are closely matched. Performance mode also has lower noise levels, so we recommend it for gamers. Turbo mode has a bigger impact on CPU-heavy applications.
Conclusion
Our internal tests validate the ROG Strix GA35 as a behemoth benchmark for pro-level gaming. It’s an all-around beast that offers huge frame rates for AAA games and high-caliber esports. This desktop dominates in every arena for players looking to hone their competitive edge. It’s available now from the following vendors:
| ROG Strix GA35 | |
|---|---|
| Availability (USA) |